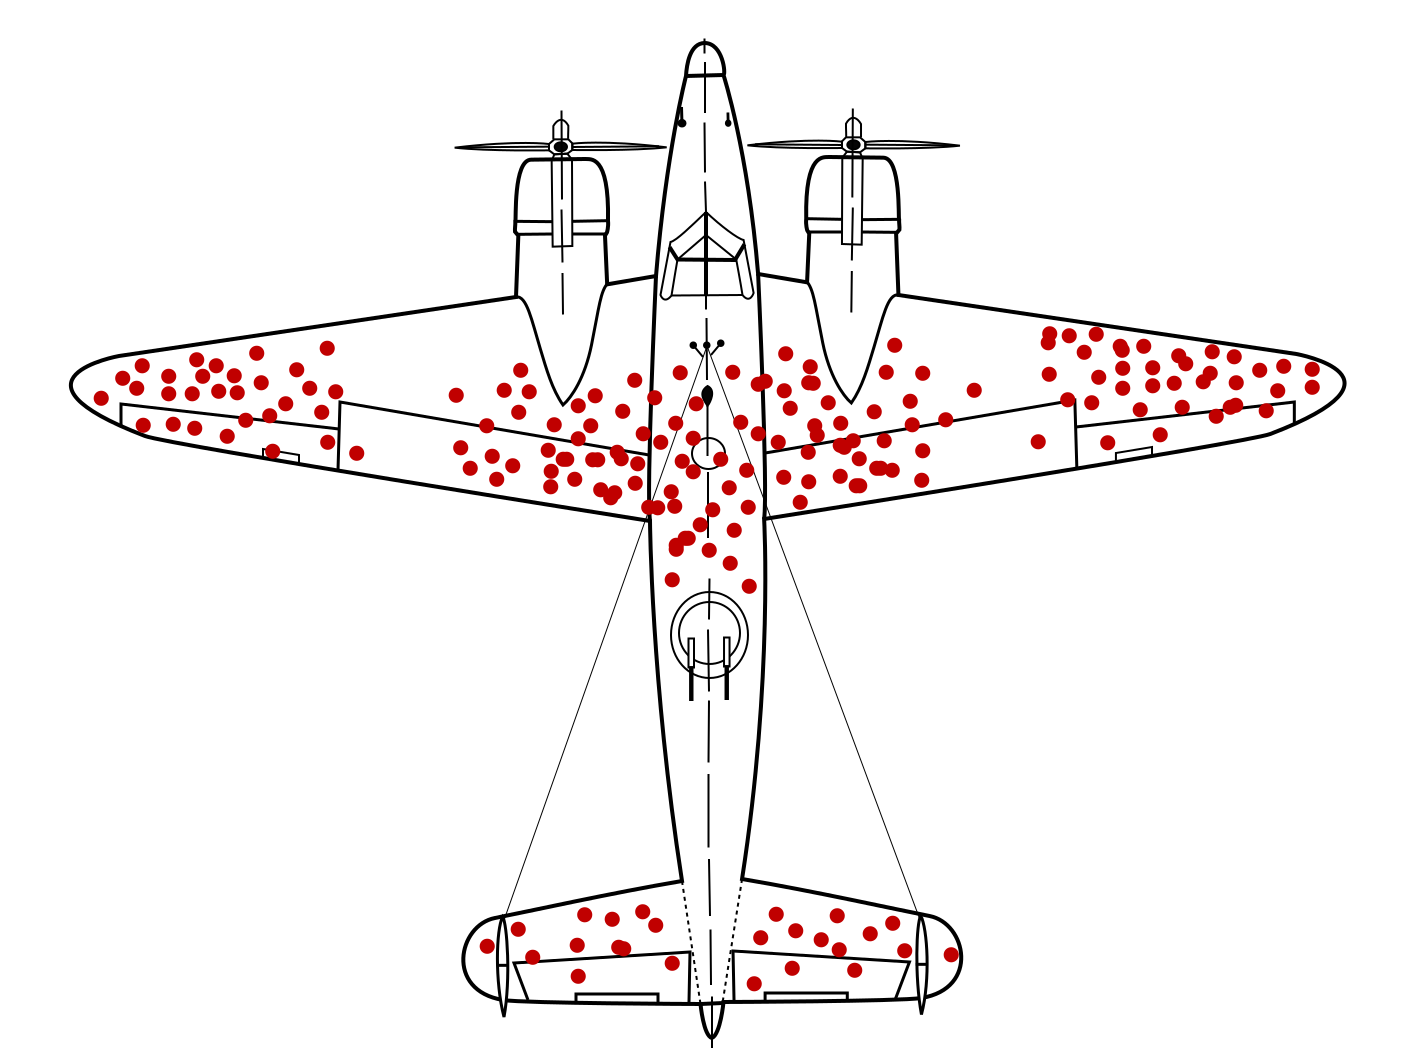
In the Second World War, the US military had a bomber problem. Too many planes weren’t coming home. Armour would help… but armour is heavy, and a plane can only carry so much of it. So where do you put it?
The story, as it’s usually told, goes like this. Analysts looked at the bombers that made it back and marked every bullet hole. The wings were riddled. So were the fuselage and the tail. The engines and the cockpit? Almost clean.
Reinforce the parts with the most holes. Easy call, right?
Every stock decision starts from what sold
Think about how your team decides what to buy, reorder, and move. Merchandising pulls sell-through by style, colour and size. Fast sellers get reordered. Slow ones get marked down or shipped to another store. Next season’s size curve comes from this season’s sales, and every store’s allocation follows its sales history.
That’s a good system. It’s run by people who know the product inside out, and sales data has a lot going for it. It’s clean. It matches what finance sees. It doesn’t argue back. When a merchandiser in Jakarta gives the Surabaya store fewer size L pieces next month, she isn’t guessing. She’s following the best evidence she’s got.
The catch is that the evidence has the same blind spot as the bullet-hole map.
Sales data only counts the demand that met stock

A receipt is the plane that came back. It records someone who wanted something and found it.
Now picture the shopper who comes in on Thursday asking for the black dress in size M. It sold out on Wednesday. She asks, hears “sorry, it’s gone,” and leaves. What does she leave behind? Nothing. There’s no line for her in the POS. The stock report shows size M at zero, sure, but it can’t tell you how many people asked for it after it got there.
So a style that sold 12 pieces and ran out looks exactly like a style that could’ve sold 40. People who study stockouts have a name for this: censored demand. Sales stop at the edge of the shelf, and whatever demand was waiting past that edge just drops out of the data.
And in fashion, you hit that edge fast. One style in four colours and six sizes is 24 separate things to keep in stock. Any one of them can run out while the rack still looks full from across the room.
Then it gets worse, quietly. Allocation follows sales, so the store that ran out of size M sells less size M, which means it gets less size M next time. The system keeps proving itself right. A sold-out size doesn’t show up as demand. It shows up as silence.
Most walk-outs in fashion start with a request
If sales and stock reports really showed where you lose sales, the reasons people walk out would be all over the place. Price. Fit. Mood. Just browsing. But they aren’t all over the place.
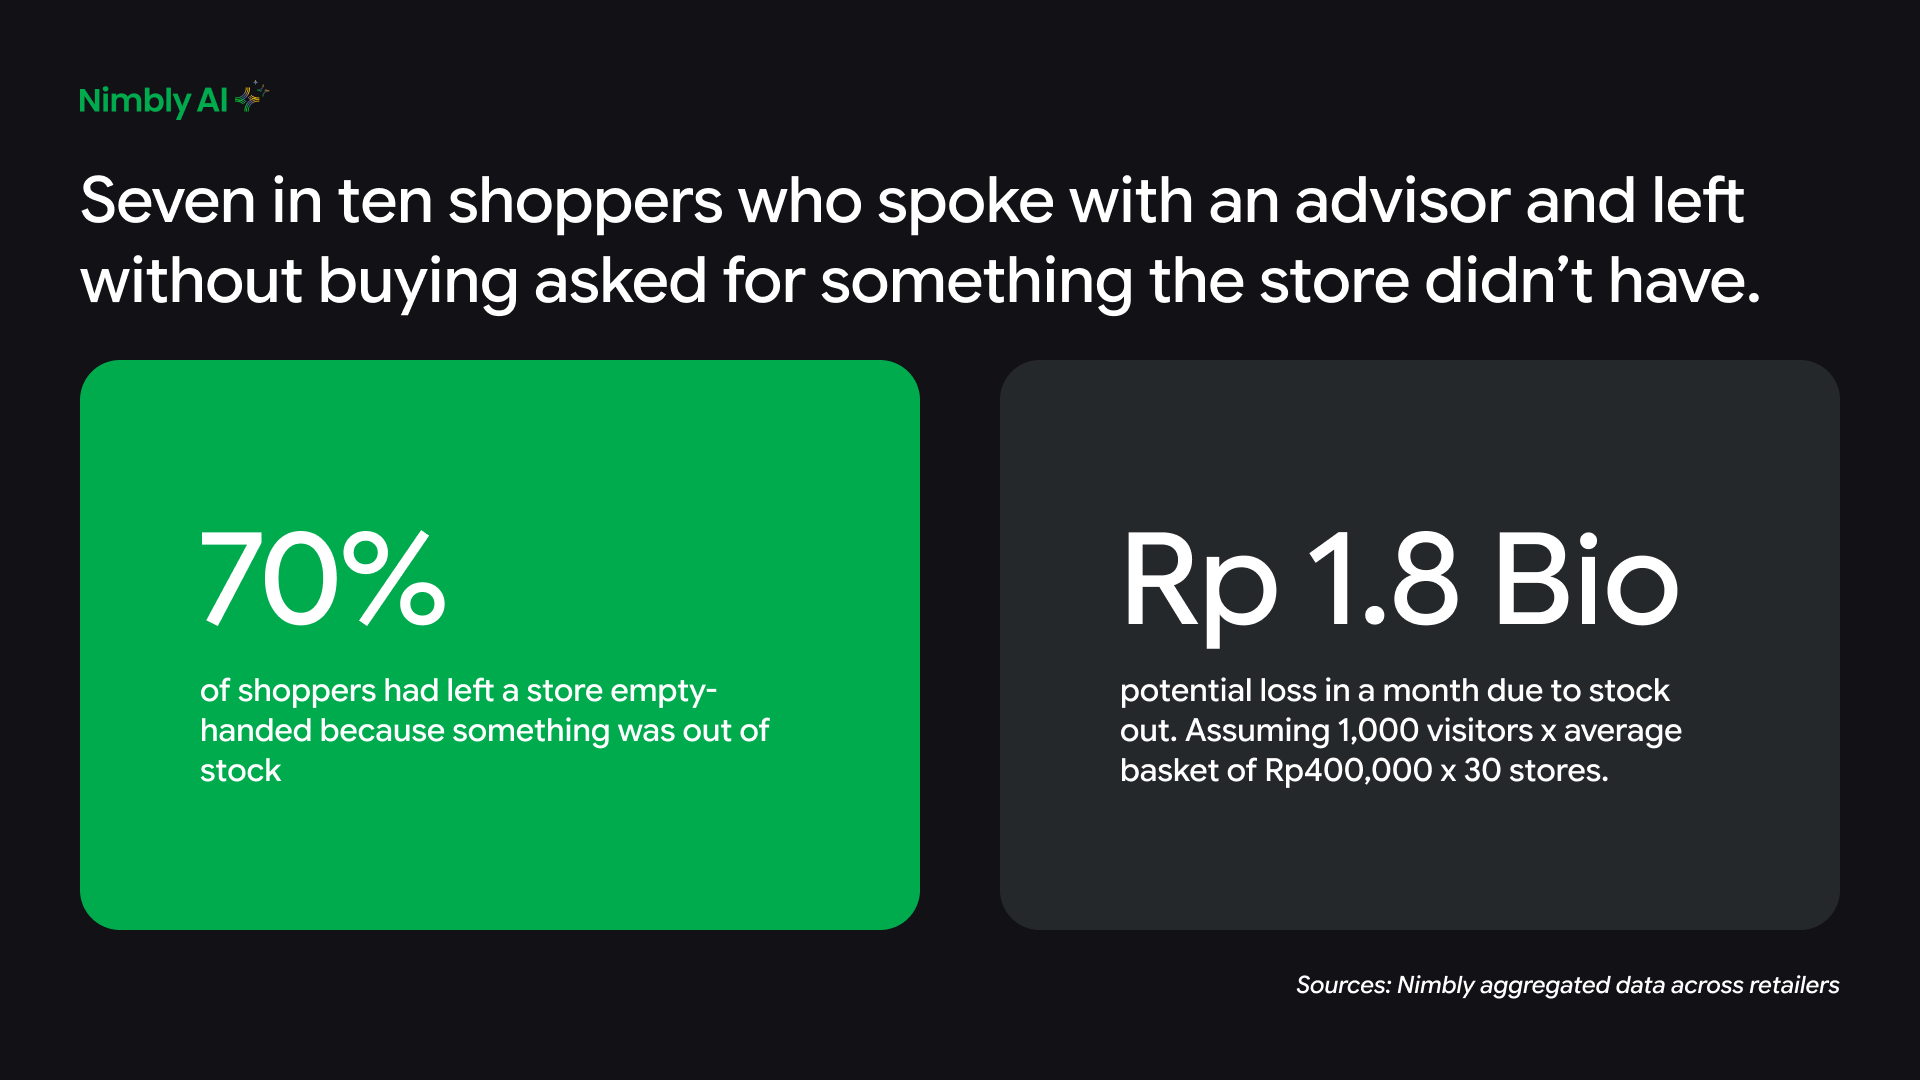
Across the fashion retailers we work with in Indonesia, more than seven in ten shoppers who spoke with an advisor and left without buying had asked for something the store didn’t have right then. Most asked for the product itself. The rest wanted a colour or a size, often of a style that was sitting right there on the floor in another variant.
And the Indonesian picture looks even sharper than the global one. A 2019 global shopper survey by Zebra Technologies, a US retail technology company, found that 39% of shoppers had left a store empty-handed because something was out of stock.
Let’s put a rough price on it. Say a store has 1,000 shoppers a month who talk to an advisor. One in five leaves without buying. The average ticket is Rp 400,000. If three-quarters of those walk-outs were stock requests, that’s 150 requests, or about Rp 60 million a month in demand that never shows up in any report. Run that across 30 stores, and you’re looking at Rp 1.8 billion a month.
These are made-up numbers, to be clear. Yours will be different. But probably not zero.
One more thing about our figure. It only counts shoppers who actually spoke to someone. The woman who flipped through the rack, didn’t see her size, and walked out without a word? She’s not in there. So if anything, the real gap is bigger.
“My out-of-stock report already tells me this”
Fair point, and partly true. Your out-of-stock report shows what hit zero and when. A good planner can estimate lost sales from the days an item wasn’t available, and that’s real, useful work. Keep doing it.
But the report only sees what’s in the system. It can’t see the colour you never bought, or the size you don’t carry in that store, or the style someone spotted on Instagram and came in looking for. It can’t tell an item nobody wanted from an item nobody could find. And it definitely can’t tell you that ten people asked for it last Saturday afternoon.
Better forecasting and better listening fix different halves of the same problem. The stock report tells you what ran out. The shopper tells you what she actually wanted. You’ll want both.
Unserved demand is data

Every “do you have this in…?” is an order your system didn’t take. Start treating it as data, and the shopper who walked out turns into one of the most useful people who visited your store that day.
It’s Wald’s map all over again. Stop reading only what came back, and start writing down what didn’t: what she asked for, the colour, the size, which store, which day. Line that up against sales and patterns jump out fast. Some gaps turn out to be allocation. Some are the size curve. A few will make you rethink what a store carries at all.
The receipt tells you what you sold. The request tells you what you could have sold.
You can test this next week, without any new system:
- Run a one-week count. Pick three stores and ask each manager to tally every request for an item, colour or size that wasn’t there. The aim isn’t a perfect record. It’s to see how big the gap is.
- Read it next to sell-through. Compare the requests with that week’s sales report. A sold-out size with many requests is a different decision from a sold-out size with none.
- Ask what you would buy differently. If the answer changes even one allocation or one size curve, unserved demand belongs in your weekly review.
The tally will show you the gap exists.
It just won’t keep showing you. Anyone who’s worked a store on a Saturday knows why: the advisor is already with the next shopper, not filling in a sheet. So the busiest hours, the ones with the most requests, are exactly when nothing gets written down. By week two, the habit usually fades.
Here’s the thing, though. The request was never silent. The shopper said it out loud, to a person, standing on your sales floor. The data’s already there, in the conversation. Someone just has to catch it.
Wald found his answer in the holes that weren’t there. Your next buy is probably hiding in the receipts that never printed.
How Nimbly helps
Nimbly Echo picks up where the tally leaves off, minus the sheet. It turns service conversations on the sales floor into data, so every request for an item, colour, or size gets captured as it’s said, along with why the shopper left, even at the Saturday peak when nobody has a free hand. Each week, you see unserved demand by item, colour, size, and store, right next to your sales report. The shoppers who walked out finally show up beside the ones who paid.